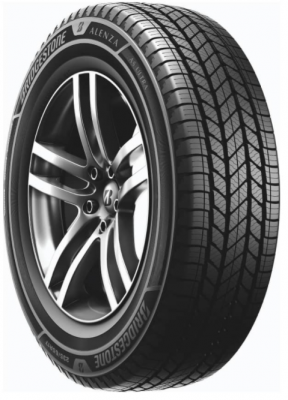
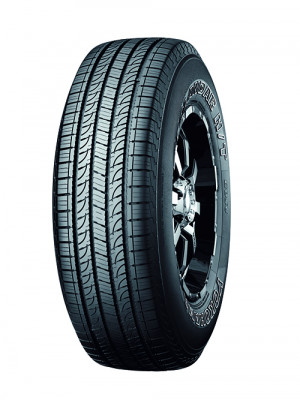
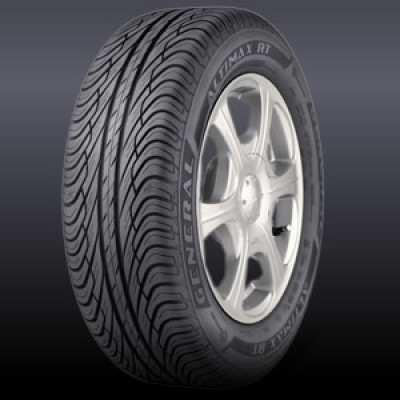
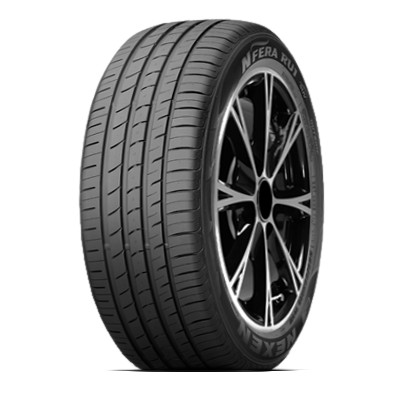
94
/ 100
Objective (60%)
–/100
No test data yet
User signal (40%)
95/100
44 owner reviews
Prices change daily — check the retailer for your size.
Our Relative Score blends 60% objective test data with 40% owner-review signal — so any two tires can be compared even if they were never tested on the same day.
Prices change daily — check the retailer for your size.
Prices change daily — check the retailer for your size.
TireWheelGuide may earn a commission from purchases made via links on this page.
Each bar is the Relative Score for that category. Expand a tile to see the test results and owner ratings behind it.
| Source | Discoverer A/T3 Sport | Roadian H/TX RT5 |
|---|---|---|
| Tyre Reviews owners | 95 | 80 |
| Source | Discoverer A/T3 Sport | Roadian H/TX RT5 |
|---|---|---|
| Tyre Reviews owners | 85 | 80 |
| Source | Discoverer A/T3 Sport | Roadian H/TX RT5 |
|---|---|---|
| Tyre Reviews owners | 75 | 80 |
| Source | Discoverer A/T3 Sport | Roadian H/TX RT5 |
|---|---|---|
| Tyre Reviews owners | 98 | 95 |
| Source | Discoverer A/T3 Sport | Roadian H/TX RT5 |
|---|---|---|
| Tyre Reviews owners | 87 | 70 |
| Source | Discoverer A/T3 Sport | Roadian H/TX RT5 |
|---|---|---|
| Tyre Reviews owners | 87 | 75 |
| Category | Cooper Discoverer A/T3 Sport | Nexen Roadian H/TX RT5 |
|---|---|---|
| Relative Score | 94 | 79 |
| Dry | 99 | 80 |
| Wet | 96 | 80 |
| Snow | 89 | 80 |
| Comfort | 97 | 95 |
| Noise | 94 | – |
| Treadwear | 94 | 70 |
| Handling | 87 | 75 |
Higher is better. The Relative Score follows your weights below; category scores do not change.
Wet grip and treadwear start at “Important” — the two things buyers rank highest. Move the sliders and the scores update instantly.
Tire A
Tire B
Only categories both tires have data for count toward the headline score.
Themes extracted from owner reviews across retailers and review sites — not the opinion of TireWheelGuide.
Not enough owner reviews yet to extract themes.
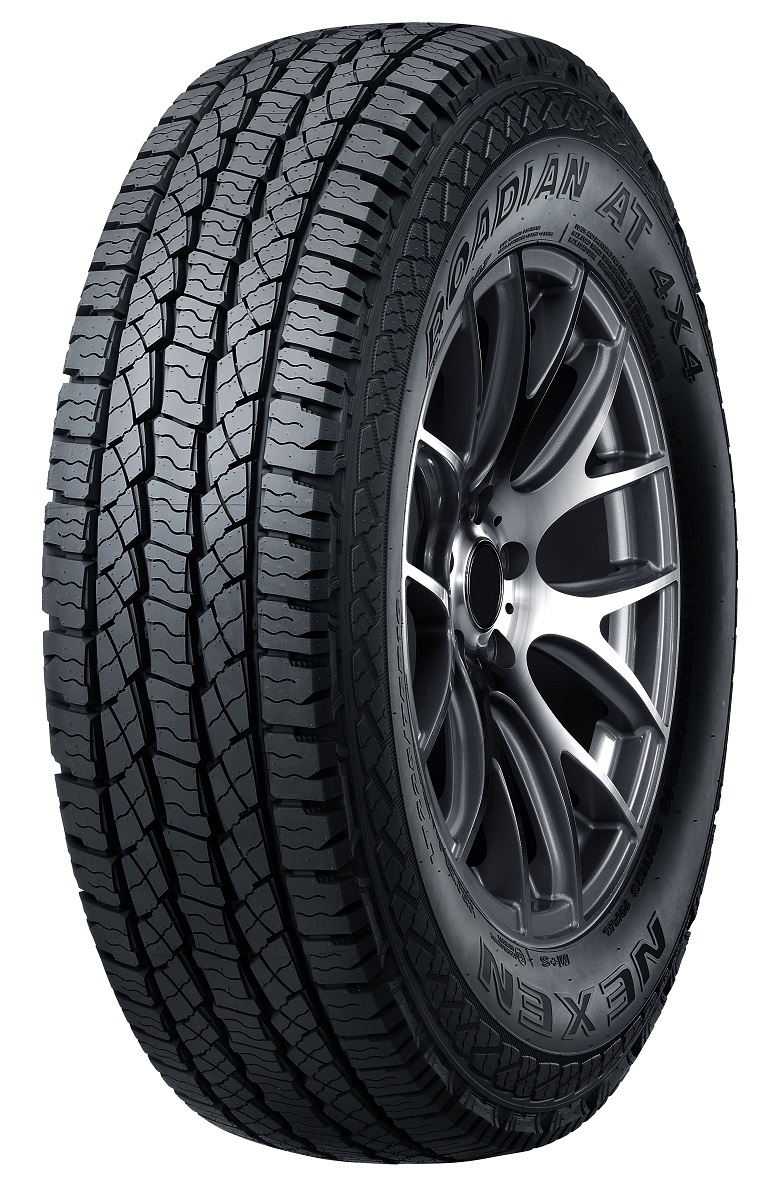
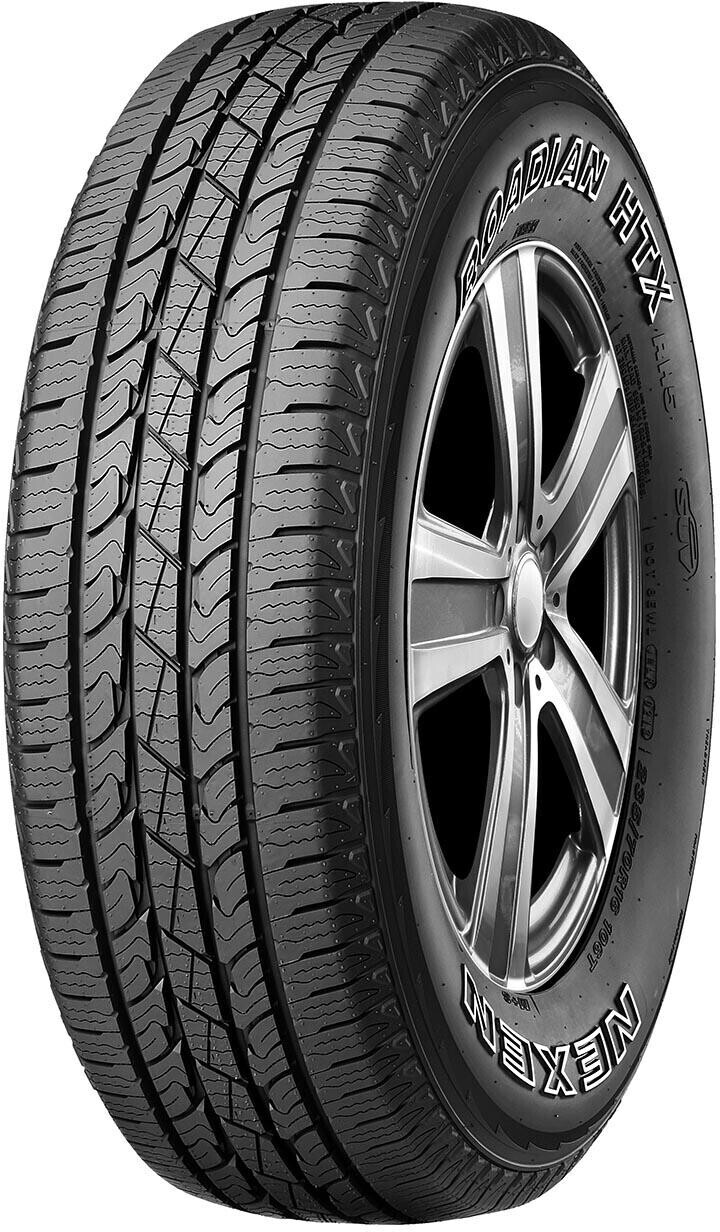
The Nexen Roadian H/TX RH5 is generally regarded as a capable OEM-fitted tire that offers strong initial performance in diverse conditions, including towing and off-road environments like sand. However, user consensus is polarized regarding its longevity and handling consistency, with several reports indicating a significant decline in performance and stability once the tread begins to wear.
| Attribute | A · Cooper Discoverer A/T3 Sport | B · Nexen Roadian H/TX RT5 |
|---|---|---|
| Category | All Terrain and Off Road All Season tire | All Season Touring tires |
| Vehicle type | SUV and 4x4 | — |
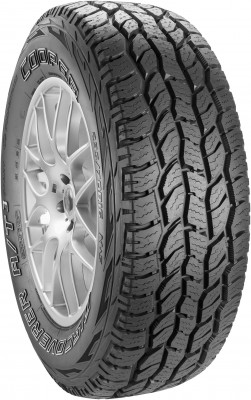
Cooper
Nexen
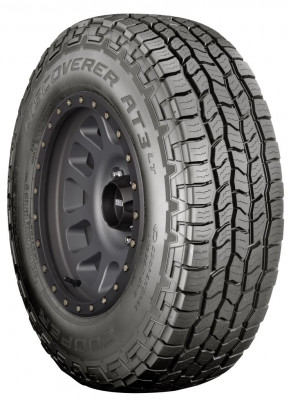
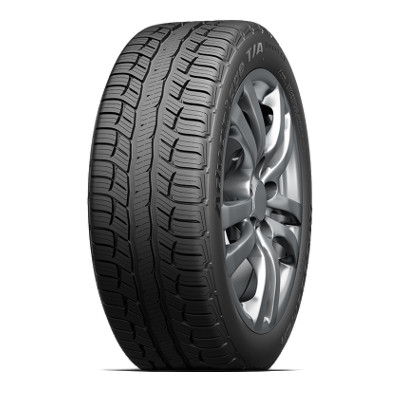
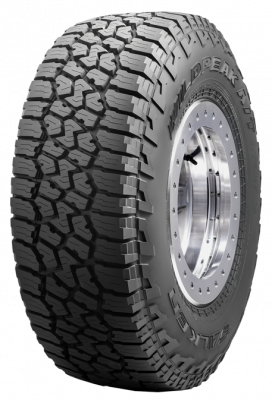
Winner: Cooper Discoverer A/T3 Sport — better treadwear, dry and wet. It leads or ties in every category we score.
Cooper Discoverer A/T3 Sport scores 94 vs 70 on treadwear.
Cooper Discoverer A/T3 Sport scores 99 vs 80 on dry.
Cooper Discoverer A/T3 Sport scores 96 vs 80 on wet.
Cooper Discoverer A/T3 Sport scores 87 vs 75 on handling.
Every category score blends two independent signals. 60% comes from professional tire tests (braking distances, lap times, noise measurements) normalized against the best tire in each test and weighted toward recent tests. 40% comes from thousands of owner reviews collected from retailers and review sites. When a tire has only one of the two, we use what exists and say so.
Community buzz from Reddit and forums is shown for context only — it never changes the score.