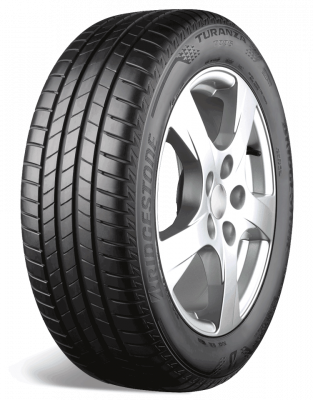
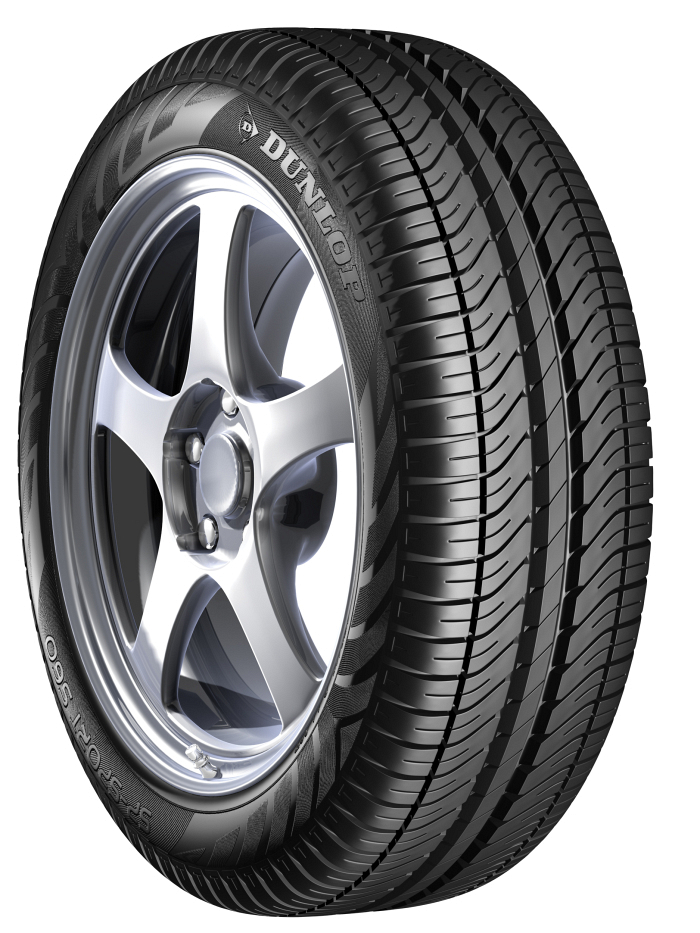
66
/ 100
Objective (60%)
–/100
No test data yet
User signal (40%)
65/100
7 owner reviews
Prices change daily — check the retailer for your size.
Our Relative Score blends 60% objective test data with 40% owner-review signal — so any two tires can be compared even if they were never tested on the same day.
Prices change daily — check the retailer for your size.
Prices change daily — check the retailer for your size.
TireWheelGuide may earn a commission from purchases made via links on this page.
Each bar is the Relative Score for that category. Expand a tile to see the test results and owner ratings behind it.
| Source | SP Touring T1 | A.Drive |
|---|---|---|
| Tyre Reviews owners | 67 | 77 |
| Source | SP Touring T1 | A.Drive |
|---|---|---|
| Tyre Reviews owners | 56 | 64 |
| Source | SP Touring T1 | A.Drive |
|---|---|---|
| Tyre Reviews owners | 73 | 70 |
| Source | SP Touring T1 | A.Drive |
|---|---|---|
| Tyre Reviews owners | 73 | 79 |
| Source | SP Touring T1 | A.Drive |
|---|---|---|
| Tyre Reviews owners | 63 | 69 |
| Category | Dunlop SP Touring T1 | Yokohama A.Drive |
|---|---|---|
| Relative Score | 66 | 72 |
| Dry | 67 | 77 |
| Wet | 56 | 64 |
| Comfort | 73 | 70 |
| Treadwear | 73 | 79 |
| Handling | 63 | 69 |
Higher is better. The Relative Score follows your weights below; category scores do not change.
Wet grip and treadwear start at “Important” — the two things buyers rank highest. Move the sliders and the scores update instantly.
Tire A
Tire B
Themes extracted from owner reviews across retailers and review sites — not the opinion of TireWheelGuide.
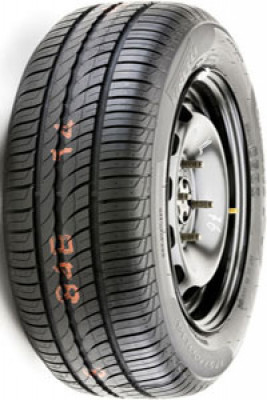
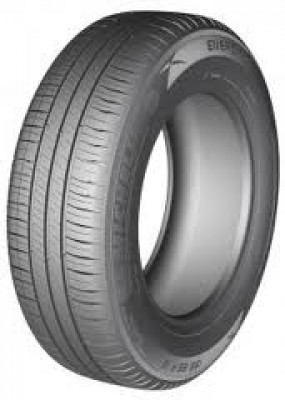
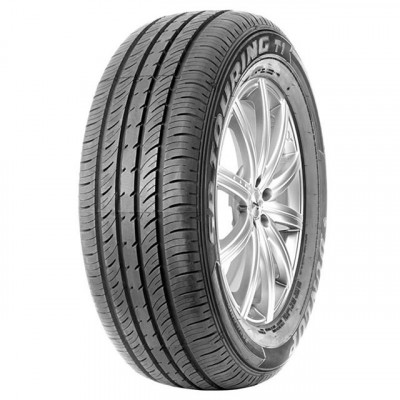
The Dunlop SP Touring T1 receives highly polarized feedback, with users sharply divided between those prioritizing low cost and those concerned by significant safety and quality issues. While some find the tire to be a durable, budget-friendly option, a substantial number of reports highlight severe deficiencies in wet-weather traction and structural integrity.
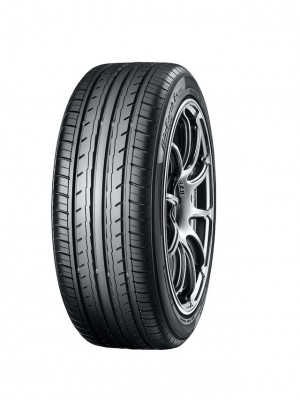
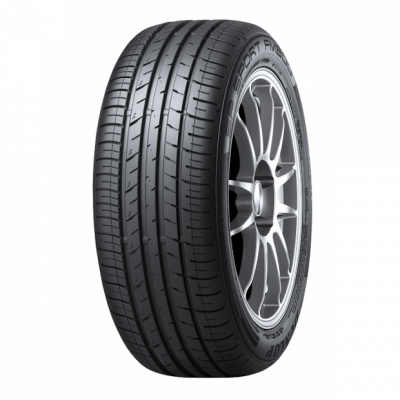
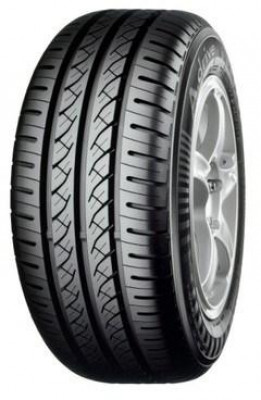
The Yokohama A Drive is a polarizing tire that generally serves as an entry-level or mid-range option, receiving mixed feedback regarding its performance. While some users appreciate its value and dry-weather handling, a significant portion of the user base reports concerns regarding wet-weather traction, high road noise, and inconsistent tread life.
| Attribute | A · Dunlop SP Touring T1 | B · Yokohama A.Drive |
|---|---|---|
| Category | Summer Premium Touring tires | Premium Touring Summer tire |
| Vehicle type | Passenger Car / Crossover | Passenger Car / Crossover |
Dunlop
Yokohama
Winner: Yokohama A.Drive — better dry, wet and treadwear. Pick the Dunlop SP Touring T1 if comfort matters most to you.
Yokohama A.Drive scores 77 vs 67 on dry.
Yokohama A.Drive scores 64 vs 56 on wet.
Yokohama A.Drive scores 79 vs 73 on treadwear.
Yokohama A.Drive scores 69 vs 63 on handling.
Every category score blends two independent signals. 60% comes from professional tire tests (braking distances, lap times, noise measurements) normalized against the best tire in each test and weighted toward recent tests. 40% comes from thousands of owner reviews collected from retailers and review sites. When a tire has only one of the two, we use what exists and say so.
Community buzz from Reddit and forums is shown for context only — it never changes the score.